Understanding Bitcoin Supply & Demand - A Backgrounder
Our Bitcoin price forecast framework is based on aggregate market supply and demand 'working together' to figure out equilibrium prices.
Microeconomic Basics
I'm an applied economist by training (agricultural economics), so view the world in terms of supply and demand of goods and services.

Our Bitcoin price forecast framework is based on aggregate market supply and demand 'working together' to figure out equilibrium prices. If price is above the equilibrium price, suppliers respond by increasing production; individuals respond by curtailing their consumption. This is Adam Smith's famous 'invisible hand' in action.
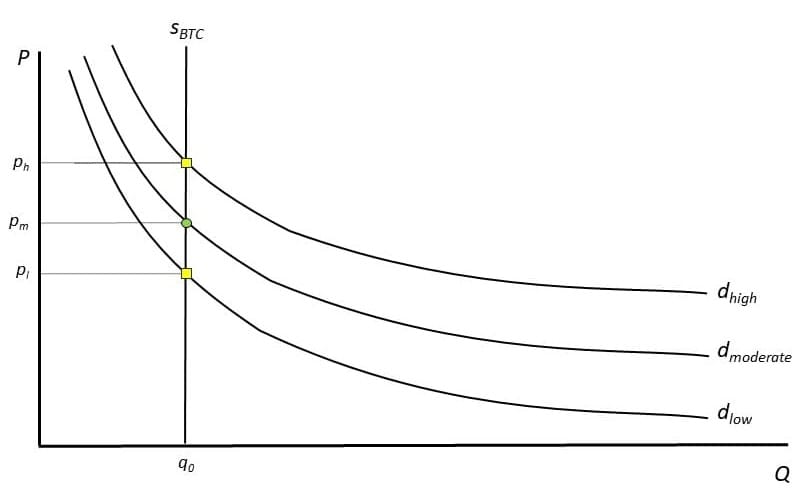
Demand curves typically slope downwards smoothly. Demand increases as price falls. But there are some buyers willing to pay and consume, even at very high prices.
For most commodities, the supply curve is upward-sloping: higher prices induce producers to increase output. Think of gold: if there is some kind of force in the economy that increases the demand for gold (e.g., a country adding to their reserves), the price of gold goes up. Big mines that were previously unprofitable fire up again; small-scale producers get back out on their claims in Alaska and the Yukon; and, if the price increase looks durable, new mines will come online.
But Bitcoin is different...

Bitcoin has a perfectly inelastic supply curve - that means that it is vertical, and producers cannot respond to higher prices, increasing aggregate production. This is because, at any particular time, the emissions of new Bitcoin entering the market from Bitcoin mining is fixed. This is one important feature of Satoshi Nakamoto's design of the Bitcoin protocol.
If Bitcoin were suddenly repriced from $100,000 to $200,000 after a government announced they were creating a new strategic reserve and demand soared, Bitcoin miners have no way to increase the total amount of Bitcoin mined, which is currently 450 per day (3.125 every 10 minutes on average). If they add more computing power, they can increase their share of the pie, but that cannot increase its size, only take away a portion from someone else. Bitcoin mining is a hyper-competitive arms race.
What is the relevant supply of Bitcoin for modeling? In general, it would be total circulating supply. But for Bitcoin, we know some coins are lost or inaccessible, and some are HODLed away, possibly forever. So, we're really interested in the liquid supply available to trade in the market.
The challenge is that we don't know with any certainty how many Bitcoin are lost, inaccessible, or permanently HODLed.

In the figure above, we are not sure which of the 3 vertical supply curves describes the liquid supply right now. Each has a different equilibrium price.
But, for Bitcoin, there is an even more important implication. If we have a high level of liquid Bitcoin in the market, big blocks of buy and sell orders have a modest impact on price (picture q3 moving right or left by an equal amount).
If we're really at q2, however, similar buy or sell orders have a much larger proportional impact because we are in the steep section of the demand curve: this is the supply shock zone.
The Modeling Challenge
Supply-side
The challenge on the supply side is simple: it involves identifying the true level of liquid supply or, at a minimum, coming up with a credible estimate of the goalposts that contain liquid supply.
Demand-side
Estimating demand is a bit more involved.
Valid demand curves are based on economic theory and exhibit certain characteristics that ensures that consumption choices follow fundamental 'rules' like consistency of choices when a person is given choice pairs (e.g., if you like mango more than strawberries, and strawberries more than bananas, then you cannot like bananas more than mangos).
Anyone can draw some ad hoc curve and use it to calculate a price equilibrium but that curve won't be credible from a behavioral perspective if it is not based in economic theory.
That means we have a limited number of options to draw on (but they are quite flexible). In our first crack at this problem, we used something called a Constant Elasticity of Demand (CES) curve, and in the updated framework we moved to an Epstein-Zin demand function (see more background in the current working paper). For both, we can be sure that the shape of the curve - which has crucial implications for projecting equilibrium prices - is economically valid.
This is a big deal for economists.
Our Current Model
That economic background provides the context for why we developed the Bitcoin price modeling framework we did. The framework:
- Allows for flexibility in choosing a vertical demand curve across a range of plausible liquid supply levels;
- Uses a theoretically valid demand curve formulation to ensure that the curvature of the demand curve is behaviorally realistic;
- Calculates market-clearing price equilibria on a daily basis;
- Is completely flexible with regards to selection of all modeling parameters, including those describing supply and demand curves, as well as the shape of a Bitcoin technological adoption curve, start and end dates, market demand multipliers, and a 'throttling' parameter that decreases Bitcoin purchases as Bitoin's price in US $ terms increase.
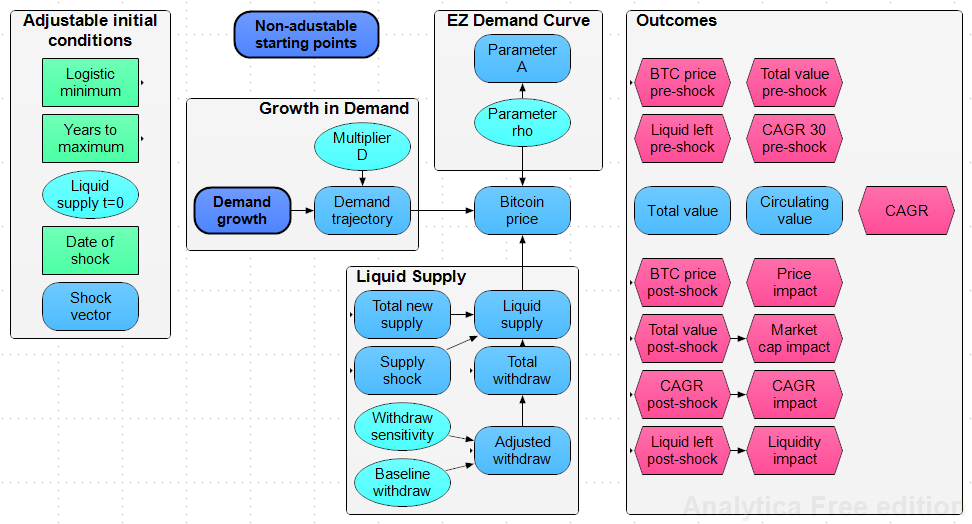
The figure below shows the current framework structure. Note the 3 main components feeding into price: growth in demand; the demand curve; and the liquid supply.
The thing that is unique about our econ-based modeling approach is that we make zero assumptions about how Bitcoin's historical price performance shapes its future performance.
Think about it, how could we realistically argue that historic price performance in the absence of supply shock conditions would be able to predict performance under supply shock conditions in the future? Bitcoin is unlike that any other commodity humans have never seen before, in that its supply is absolutely and immutably fixed at 21 million.
Nor do we make any assumptions about annual growth rates into the future (as MicroStrategy's Bitcoin24 model does) or Bitcoin's appetite for demonitizing other capital assets (as Ark Invest does).
What becomes interesting, from a modeling validation perspective, is: under what conditions do various modeling options and outputs align?
- When do our projections, based on supply and demand fundamentals, align with power law trends?
- What level of annual growth rates are consistent between Bitcoin24 and our model?
- How do assumptions about different levels of demonetization of various other asset classes lead to similar results to what we derive from supply and demand modeling?
These are interesting questions - our supply- and demand-oriented modeling approach is the one that can integrate different kinds of factors to really explain - not describe - Bitcoin's price trajectory possibilities.


Comments ()